![]()
Documentation
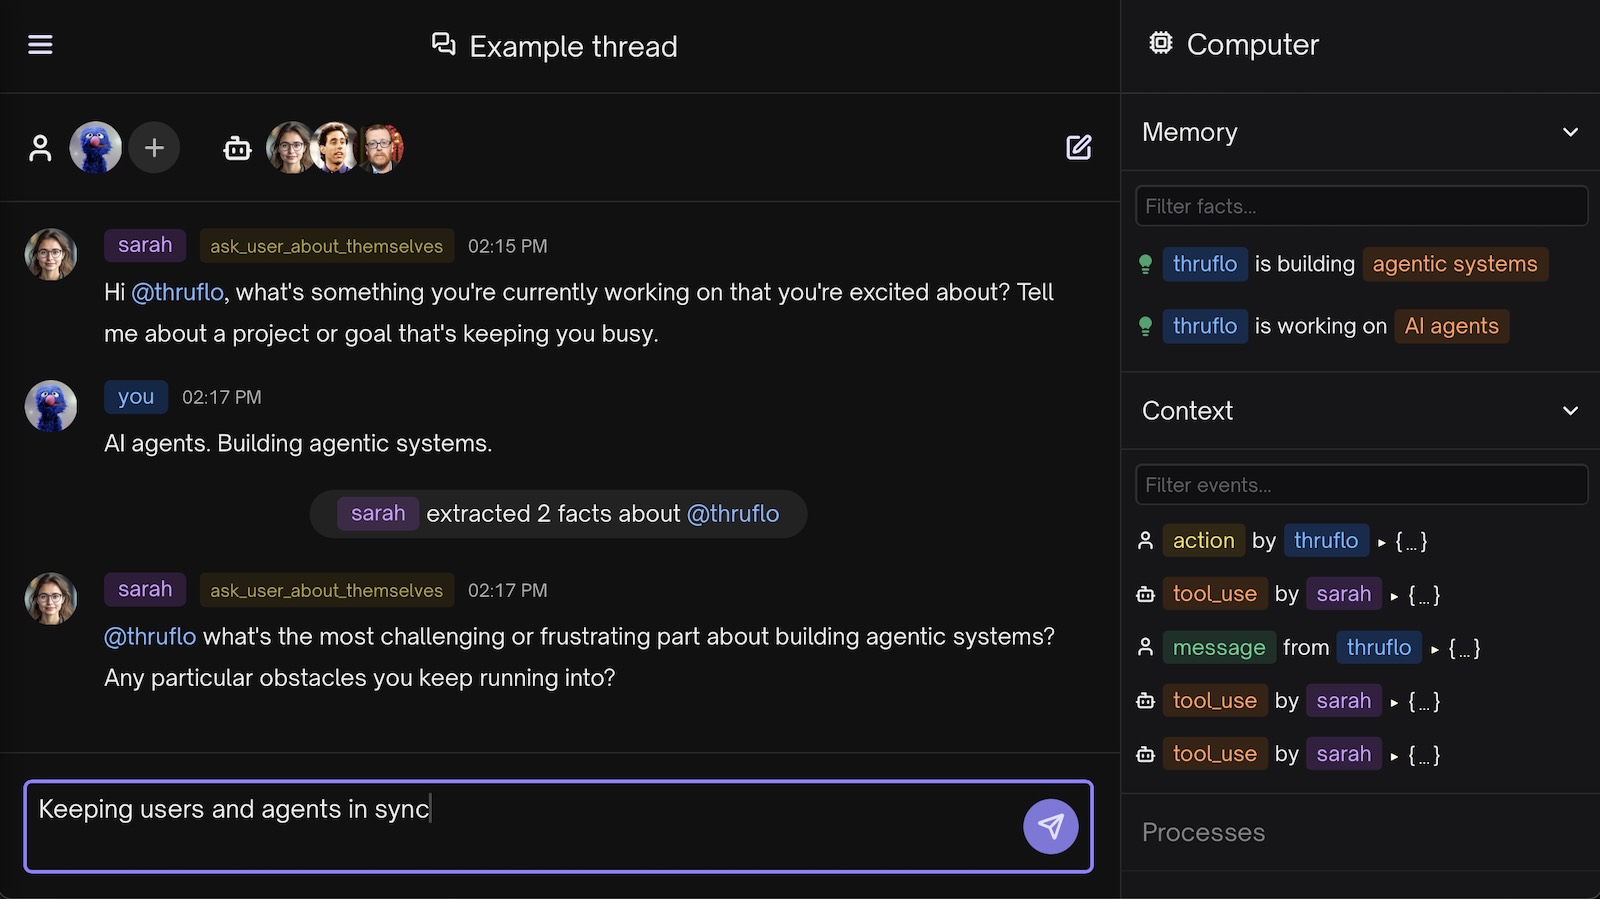
How to build fast, modern apps and multi-agent systems with Electric.
Getting started
Start with the Quickstart for the fastest way to get up-and-running.
The easiest way to use Electric in production is the Electric Cloud. Alternatively, the Deployment guide covers how to self host.
What's documented where?
🔭 Product documentation is split across multiple sites
It's worth taking a moment to understand what's documented where.
This website contains the main documentation for Postgres Sync.
Usage examples and recipes often use Postgres Sync together with TanStack DB. Guides like Auth and Security are also generally relevant for Durable Streams.
Project websites
Durable Streams, TanStack DB and PGlite each have their own docs:
Examples
See the Demos section and examples folder on GitHub for demos and examples, e.g.:
The integration docs also illustrate common patterns, e.g. using Electric with frameworks like TanStack and Phoenix and platforms like Supabase and Cloudflare.
Source code
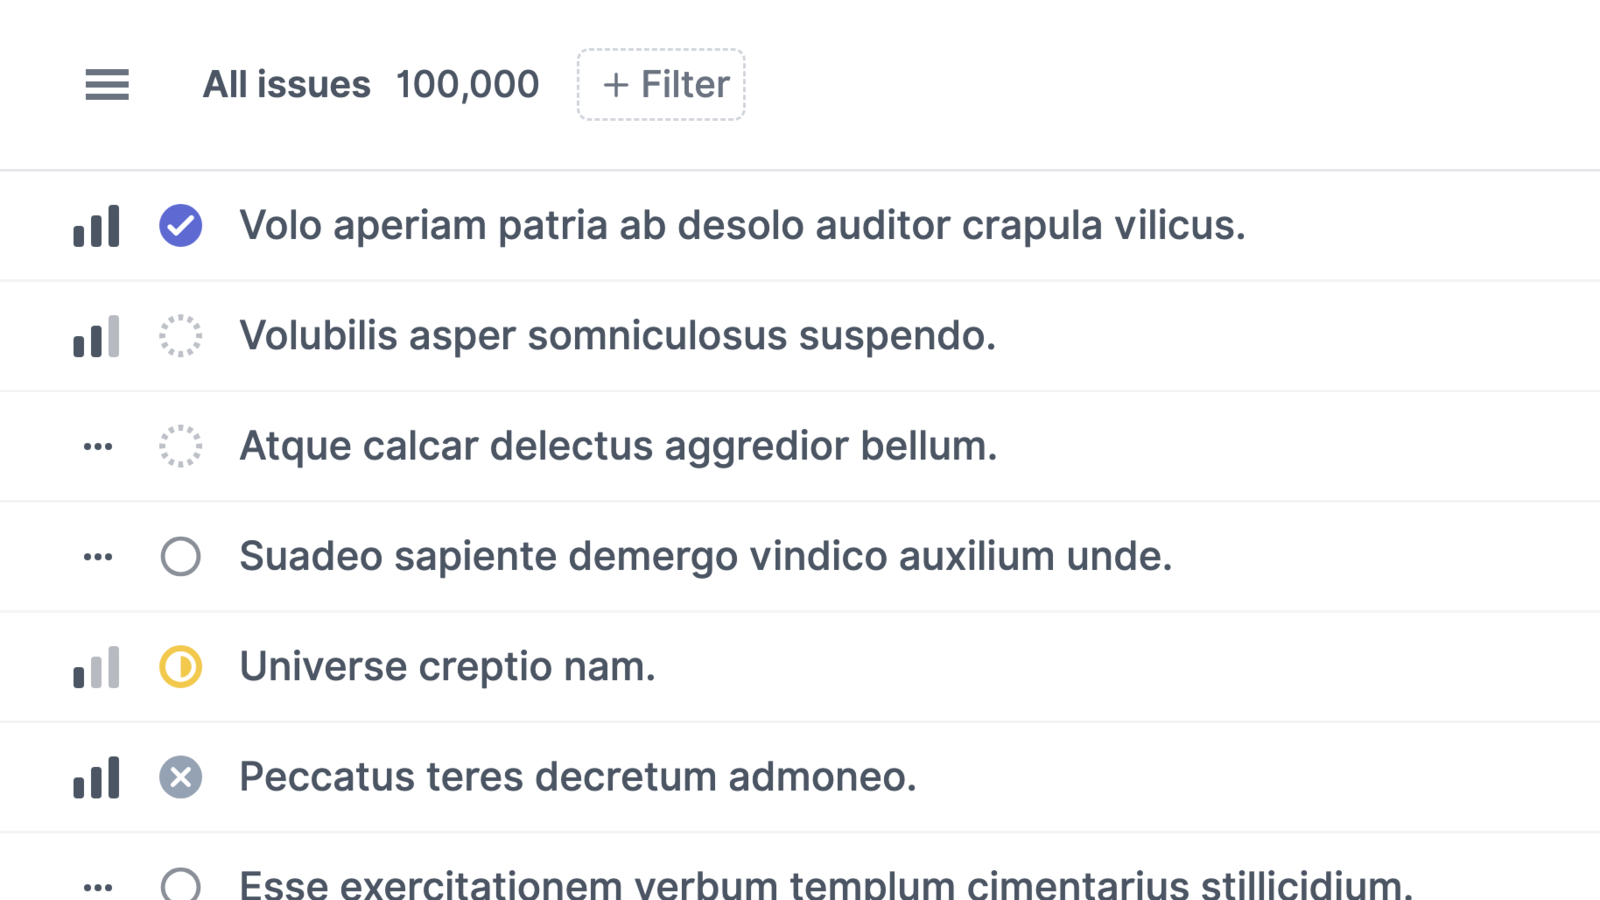
Electric is an open source project developed at github.com/electric-sql. Check out the source code, issues and development in progress there.
Support
See the Community page for information on support and events, including our community Discord where you can ask questions and get support.